Status Page Aggregation

Status page aggregation is the process of collecting, normalizing, and presenting updates from multiple vendor status pages in a single, unified view.

If you, like most businesses rely on dozens or hundreds of third-party SaaS platforms, APIs, and cloud services aggregating status pages is an efficient solution to monitor uptime of multiple providers.

Here we’ll explore status page aggregation in depth: what it is, why it matters, and how it helps teams monitor multiple status pages of the third-party SaaS and cloud services they depend on.

List of status pages

As digital services power everything from startups to global enterprises, status pages have become a vital communication bridge. These pages offer real-time transparency into the health of a service. Whether it’s a SaaS platform, a mission-critical API, or the infrastructure that underpins B2B applications.

For DevOps teams, IT departments, and customer success managers, a clear and accurate status page reduces uncertainty, prevents redundant support requests, and builds trust with users.

As modern tech stacks grow increasingly complex, often depending on dozens or even hundreds of third-party services, the visibility provided by status pages is no longer a nice-to-have. It’s essential.

Imagine for a moment that each service your organization relies on is like a unique piece of art. Some are intricate and delicate, like handcrafted miniatures (your payment gateway, your CDN). Others are vast and imposing, like murals (your cloud platform, your core app infrastructure).

Each service status page is the frame around that artwork, presenting it, providing context, but also drawing a clear boundary between the piece and the outside world.

Now, picture trying to monitor all these artworks across dozens of separate rooms. Without a gallery map and a well-curated layout, you’d waste time and energy darting between rooms, missing key details along the way.

Status page aggregation is that gallery map: a way to bring all those framed works into a single, coherent space where you can view, interpret, and act on them efficiently.

This article is your guide through that gallery. We’ll explore the purpose and value of status page aggregation, break down the tools and techniques available today, and examine the challenges of designing and maintaining effective status aggregation systems.

Whether you’re just starting to monitor a handful of providers or managing a complex environment with hundreds of dependencies, this piece aims to offer both strategic insights and practical advice.

By the end, you’ll have a clear view of how to design your own status page aggregation strategy, one that helps your team stay ahead of issues and keeps your users informed when it matters most.

What Is Status Page Aggregation?

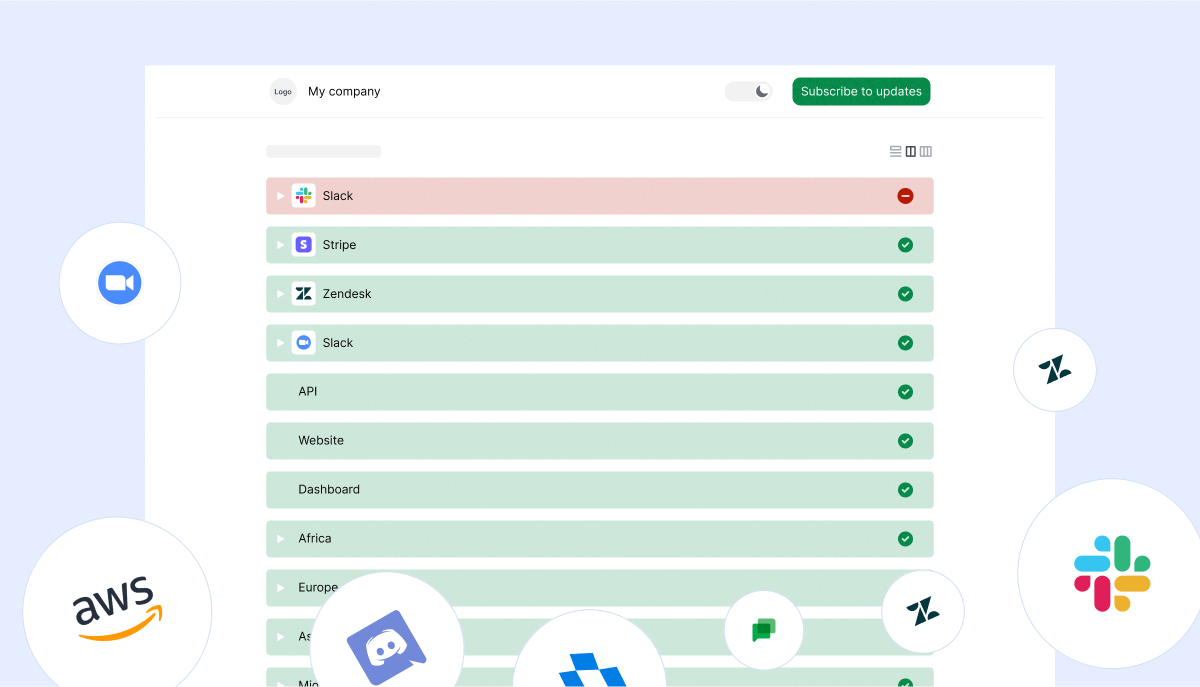
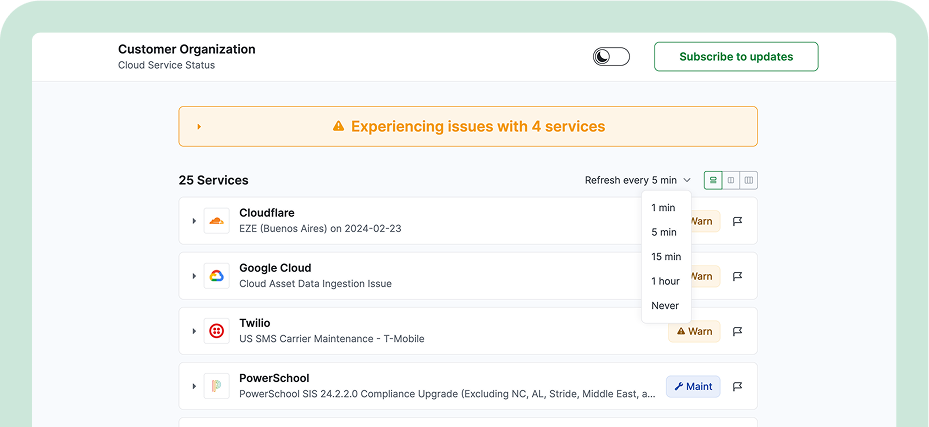
Unified status page aggregation interface

Status page aggregation is the practice of collecting and standardizing availability information from multiple status pages into a single, unified interface.

These status pages are maintained by vendors, cloud providers, and SaaS services to share official messages about downtime, its cause, planned updates, post-mortems, and other incident details.

Enterprises often depend on multiple APIs, cloud services, and third-party providers to run operations and deliver their own products or services to customers. With this many dependencies, companies face the challenge of tracking numerous status endpoints. They do it manually or through custom scripts.

The solution for them is status aggregation. Instead of visiting dozens of vendor status pages one by one, status page aggregation delivers transparency. It brings all critical status updates, outage alerts, and uptime metrics together in one place.

This makes it easier for DevOps, IT, and support teams to monitor the real-time health of their broader ecosystem and respond effectively.

Why Do Companies and Tech Professionals Need Status Page Aggregation?

Dependecies monitoring aggregation page

In modern setups, most organizations depend on a growing number of third-party services, APIs, SaaS tools, and cloud providers.

Each of these services typically maintains its own status page, but manually monitoring dozens or even hundreds of these pages is inefficient and prone to gaps. That’s where status aggregation becomes essential.

Here are the key reasons companies and tech professionals benefit from status page aggregation:

Centralized visibility across all dependencies

Status page aggregation brings together the status of multiple services into one dashboard. This unified view helps DevOps, IT, and engineering teams monitor critical services without switching between individual status pages or relying on custom scripts.

Early detection of outages and disruptions

Aggregators can provide early warning signals (StatusGator, StatusPageAggregator) by tracking both official and unofficial indicators of service issues. This enables teams to act quickly, often before customers or internal users are impacted.

Reduced operational complexity

By aggregating updates from third-party services, companies reduce the overhead of maintaining manual checks, scripts, or fragmented monitoring processes. This simplifies workflows and frees up engineering resources for higher-value work.

Improved incident response and communication

A status page aggregator ensures all stakeholders, from IT and customer support to the executive teams, have a consistent, real-time view of service health. This makes it easier to coordinate incident responses, notify users, and reduce support ticket burden during outages.

Historical insights for reliability reviews

Many aggregators store and visualize historical uptime data, helping organizations evaluate vendor reliability over time and make informed decisions about service providers. For example, StatusGator stores years of historical uptime, and recently even outages that were never officially acknowledged by providers.

Customization for different teams

With status page aggregation, companies can create custom views for different teams. For example, customer support can monitor services that directly affect end users, while engineering can focus on API and infrastructure dependencies.

How Status Page Aggregation Works

While tools vary, most aggregators follow a common three-stage process:

1

Automated Checkers

Status page aggregators use lightweight bots or services to continuously monitor vendor status pages. These checkers operate at frequent intervals, typically every few minutes, and retrieve status data from vendor through various means:

  • Official APIs provided by service vendors
  • Undocumented JSON endpoints exposed by status pages
  • HTML scraping, where necessary, to parse human-readable web content

This flexibility allows aggregators to support thousands of services, even when providers don’t offer formal API access. In advanced systems like StatusGator, additional unofficial signals — such as metadata changes, content updates, or incident-related web activity — can help surface early warning signs of trouble.

2

Data Normalization

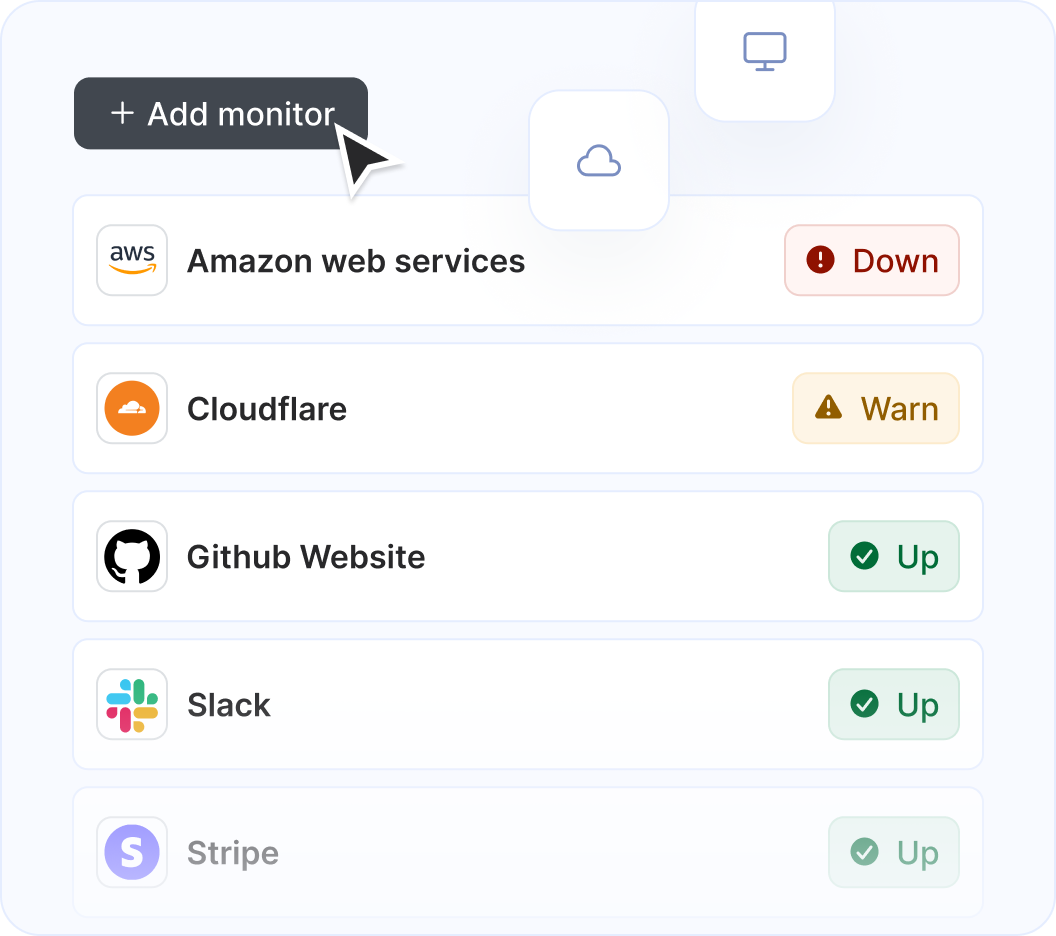
Each vendor’s status page uses different terminologies, such as operational, degraded performance, or partial outage. Aggregators standardize these statuses into uniform categories like up, warn, down, and maintenance to maintain clarity across diverse sources.

  • Statuses are mapped into a consistent set of categories, typically up, warn, down, and maintenance, so users can easily understand the overall health of all monitored services at a glance.
  • Components or subsystems (like API, dashboard, or billing) are also categorized for more granular monitoring.
3

Display and Notifications

Normalized data is compiled into a central dashboard where users can view the real-time status of all services in one place. Behind the scenes:

  • Aggregators poll endpoints regularly to ensure the dashboard reflects the most current state.
  • Notifications via Slack, email, webhooks, or other integrations are triggered on meaningful changes, such as outages or restorations.
  • Users can customize alert rules, choosing to be notified only about certain services, severity levels, or components.

Enhanced features

Advanced aggregators like StatusGator go beyond basic aggregation by adding real-time anomaly detection. This enables the delivery of early alerts, sometimes detecting disruptions before they are officially published on a provider’s status page, offering critical lead time for teams to react proactively.

Early Detection in Status Page Aggregation

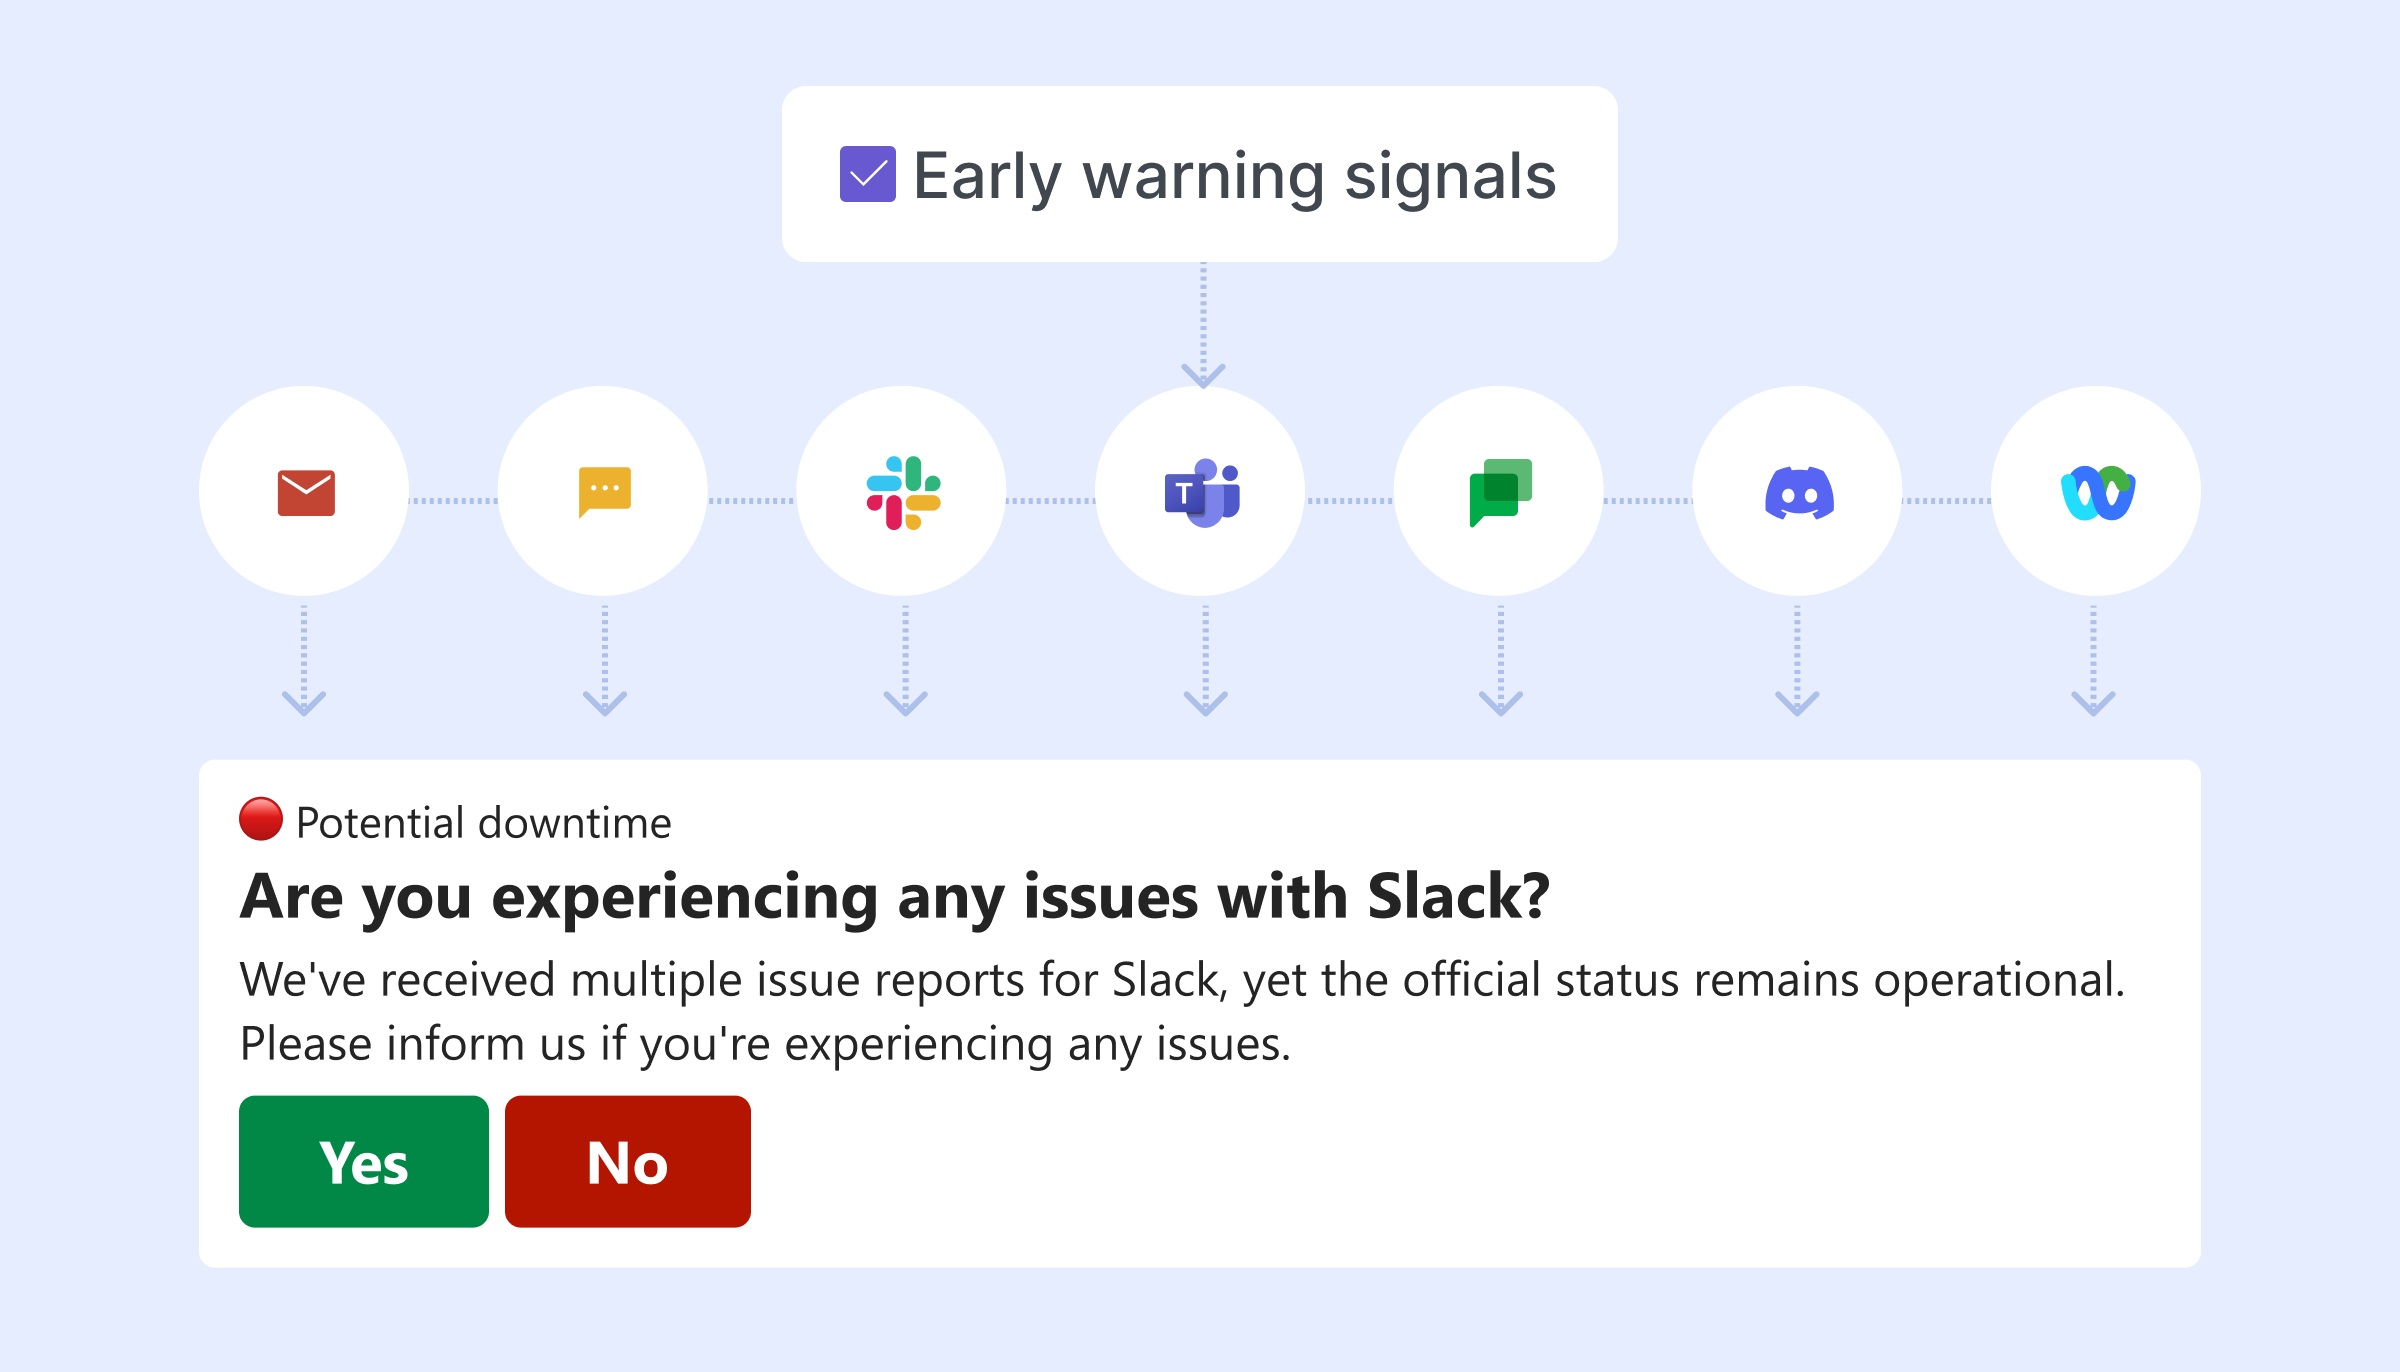
Early Warning Signals flowchart

Early detection in status page aggregation refers to identifying potential service disruptions or outages before they are officially reported on a provider’s status page.

Status aggregators, like StatusGator, enhance standard aggregation by monitoring unofficial signals. These include incident reports, changes in availability, or anomalies from users to provide alerts faster than waiting for an official status update.

This capability is important because it gives organizations a head start in responding to outages that could impact their operations.

Early detection helps IT, DevOps, and customer support teams take proactive measures, notify stakeholders, and mitigate the effects of service disruptions on customers and internal processes.

Early Warning Signals in Action

StatusGator advantage

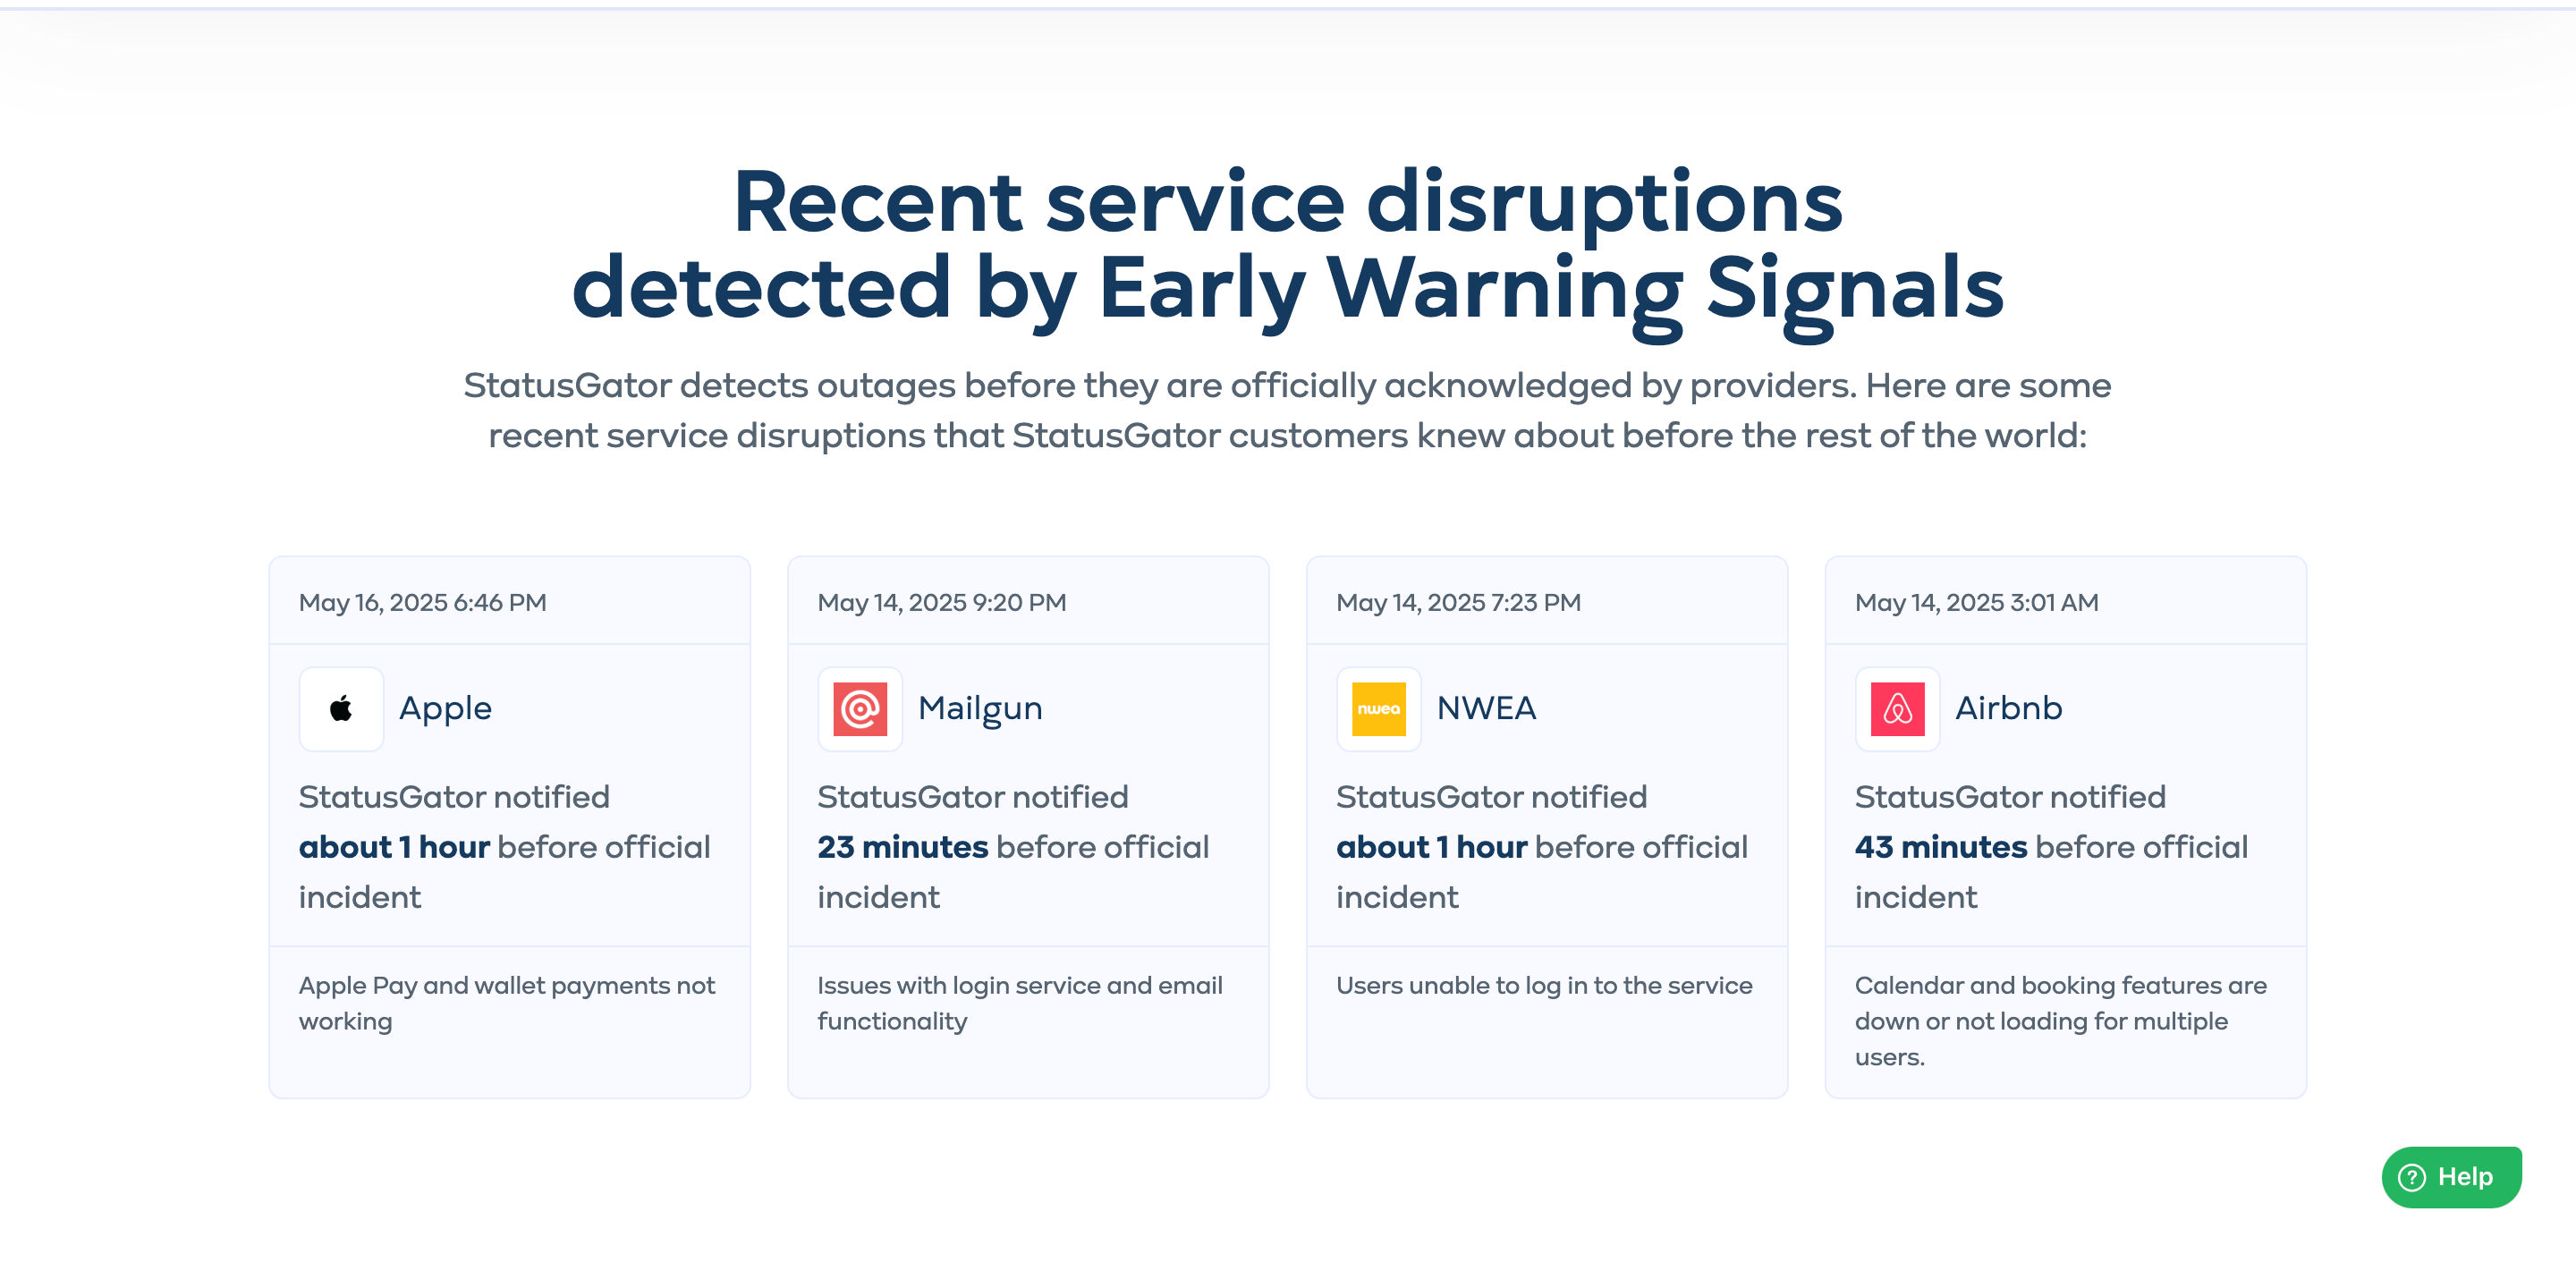
On average, StatusGator detects outages 54 minutes before official announcements.

That's the ongoing track record, not a one-time story. On July 23, 2026, StatusGator flagged an Azure outage a full hour before Microsoft acknowledged it. And on July 17, it caught a global Claude outage 27 minutes before Anthropic's status page updated. Every plan gets Early Warning Signals, including Free.

Who Needs Status Page Aggregation?

Enterprises and Tech/IT Teams

Modern organizations depend on a complex web of internal systems and external services. Aggregation simplifies status monitoring, enabling IT teams to respond faster and reduce manual effort. Historical uptime data aids in risk assessment and vendor evaluation.

DevOps and SRE Engineers

For DevOps teams, downtime can quickly cascade across systems. Aggregation provides immediate visibility into vendor issues affecting production systems. Early-use cases include component-level tracking and refined alert pipelines.

Customer Support Teams

Support teams benefit from early outage alerts, often before widespread customer impact occurs. This proactive insight enables faster customer communication, reducing ticket volume and improving user experience.

Managed Service Providers (MSPs)

MSPs can leverage status aggregation to monitor client environments proactively. Instead of reacting to incidents, they can alert clients early about the disruption and demonstrate operational diligence.

E-commerce and Revenue-Critical Services

For e-commerce and SaaS businesses, even brief downtime can result in revenue loss. Status page aggregation enables teams to monitor payment processors, CDNs, and infrastructure dependencies, ensuring they stay informed about maintenance and service disruptions.

Competitive Monitoring

Competitive intelligence teams can use aggregated status data to benchmark reliability across peer services by tracking outage frequency and downtime duration.

Education and K‑12 Institutions

Schools and universities depend on edtech tools and cloud platforms. Aggregators help IT in education reduce support requests during outages by providing a central status overview.

Types of Status Page Aggregation Tools

DIY vs. Commercial Aggregation Tools

Organizations exploring status page aggregation typically face a choice: build an internal solution or adopt a commercial tool.

DIY aggregation often starts with scripting simple “checkers” that periodically scrape or query vendor status pages. These homegrown solutions might funnel data into internal dashboards, Slack alerts, or monitoring platforms.

While this approach is cost-effective upfront and highly customizable, it comes with a number of hidden costs:

  • The scripts need constant upkeep. Even a minor change in a page’s layout can silently disable monitoring, leaving teams unaware of critical downtime.
  • Vendor status pages frequently change structure, APIs evolve or deprecate, and HTML scraping can easily break without notice.

Commercial aggregators like StatusGator offer pre-built integrations, automatic normalization of disparate data sources, and robust notification systems.

These tools handle the complexity of data ingestion, parsing, and delivery, providing real-time or near-real-time status updates across hundreds or even thousands of services.

More importantly, tools like StatusGator offer status pages. Considering that the cost of a status page increases (so does the maintenance of DIY solutions), check out ready made tools. They shift the burden of maintenance away from internal teams, allowing them to focus on incident response rather than infrastructure upkeep.

Aspect DIY Aggregation Commercial Aggregator
Setup & Customization Highly customizable; teams can tailor scripts and dashboards exactly to their needs. Pre-built integrations with broad service coverage and configurable notifications.
Cost Low upfront cost — often just engineering time. Subscription-based; ongoing cost but predictable and scalable.
Maintenance High — scripts and parsers require continuous upkeep as vendor APIs, page structures, and formats change. Low — provider handles API changes, format shifts, and integration updates.
Reliability Risk of silent failure if vendor pages change; can miss critical incidents without immediate awareness. Reliable ingestion and normalization of data; tested against many services and formats.
Scalability Harder to scale — each new service adds complexity and maintenance overhead. Easily scales to hundreds or thousands of services with minimal effort from the user.
Time to Value Slower — requires building, testing, and maintaining custom tooling. Fast — ready to use out-of-the-box with immediate visibility into many services.

Crowdsourced vs. Official Status Sources

Another key distinction lies in the source of data. Some platforms, such as Downdetector, rely on crowdsourced outage reports, aggregating user-submitted issues and social sentiment.

These sources offer the benefit of early detection, sometimes surfacing outages before a vendor updates its official status page. However, they can also produce noise, false positives, or reflect localized problems that don’t represent a service-wide issue.

By contrast, official vendor status pages, when reliably updated, offer structured, authoritative insights. Aggregators that pull directly from these sources provide more consistent and verifiable data. Still, relying solely on vendor-managed data introduces its own set of challenges.

Aspect Crowdsourced Sources Official Status Sources
Source of Data User-submitted reports, social sentiment, and public observations. Updates published by the vendor on their official status page or API.
Early Detection Often faster at surfacing emerging issues, sometimes before vendors post updates. May lag behind reality — vendors can delay acknowledgement or posting of incidents.
Reliability Variable — depends on report volume, user accuracy, and sentiment analysis. Generally more consistent and verifiable, though gaps exist if vendors underreport or delay updates.
Risk of False Positives Higher — local ISP issues or unrelated problems can skew perception of an outage. Lower — focuses on service-wide issues confirmed by the vendor.

Challenges of Aggregation Without a Ready-Made Solution

For teams opting to build or manage their own aggregation pipeline, a number of technical and operational challenges can emerge:

Data Consistency and Quality

Vendor status pages vary widely in structure, terminology, and update cadence. Some offer well-formed APIs or RSS feeds. Others – static web pages that are updated manually. Normalizing these disparate formats into a cohesive view requires custom parsing logic, which is brittle and error-prone.

Update Frequency and Incomplete Data

Many status pages don’t update in real time. Vendors may delay acknowledging issues or updating resolution statuses. In some cases, outages are quietly fixed without ever appearing on a status page, leading to blind spots. Some services never report minor disruptions at all.

Rate Limiting and API Restrictions

Even when APIs are available, vendors often impose rate limits or require authentication, making frequent polling difficult. Exceeding those limits can result in temporary bans or dropped data, further complicating aggregation efforts.

Latency and Real-Time Limitations

Building a truly real-time status aggregator is challenging. Vendor status data might lag behind reality by minutes or even hours. Crowdsourced signals can close this gap but add noise. Teams must decide whether they prioritize speed or accuracy and design accordingly.

Legal and Ethical Considerations

Scraping vendor status pages can violate terms of service, especially if done aggressively or without permission. Commercial aggregators typically handle these legal gray areas more carefully, often establishing formal relationships with vendors. DIY setups may run afoul of acceptable use policies, creating risk for the organization.

Top Status Page Aggregation Tools

Tool Early Detection # of Services Monitored Integration Support Open Source Private Status Pages
StatusGator

Yes (branded Early Warning Signals, on every plan incl. Free)

10,000+ Slack, Teams, Discord, Webhooks, etc. Free OSS aggregator on GitHub

Yes

(Enterprise)

IncidentHub

No

Hundreds Slack, PagerDuty

No

No

StatusSight

No

~3,000 Basic integrations

No

No

Downdetector

Yes, crowdsourced

Many, consumer-focused

No

No

No

UptimeRobot Dependency Monitoring (formerly IsDown) Unconfirmed if carries over into UptimeRobot. Excluded from free plan. 6,000+ Slack, PagerDuty

No

No

OSS Aggregator (StatusGator GitHub)

No

Configurable Self-managed

Yes

Yes

DrDroid

No

Configurable Self-managed

Yes

Yes

StatusGator

Recent service disruption detected by Early Warning Signals

StatusGator is a leading status page aggregator for IT, DevOps, and support teams. The tool monitors 10,000+ cloud services, SaaS tools, and APIs in one centralized dashboard. Early Warning Signals, StatusGator's early-detection system is included on every plan, including Free.

Additionally, StatusGator monitors services that do not have official status pages at all, like SentinelOne. Thus, StatusGator alerted its users on the SentinelOne outage in May 2025, nearly an hour before the official message was issued. This proactive monitoring allows users to receive alerts before incidents are widely reported.

StatusGator also supports both public and private status pages, giving organizations the flexibility to share service status information transparently with external users or to create internal dashboards tailored for specific teams.

Users have access to SSO, private status ingestion, and they can monitor their SSL certificates.

With deep integrations, customizable notifications, and the ability to aggregate services across multiple providers, StatusGator enables teams to stay ahead of disruptions and maintain high uptime.

IncidentHub

IncidentHub is a status page aggregator designed to track the public status pages of cloud and SaaS services. It consolidates vendor outages and maintenance updates into a single dashboard, offering real-time alerts when dependencies experience incidents.

IncidentHub offers component-level monitoring, auto-detection, incident drill-downs, and integration with Slack, PagerDuty, and webhooks. IncidentHub tracks fewer providers than StatusGator, and does not offer early detection.

StatusSight

StatusSight is a real-time status page aggregator that monitors and provides outage alerts for thousands of services and APIs. After signing up, users can to build a unified dashboard with live incident timelines for services such as Cloudflare, GitHub, and Trello, helping teams stay ahead of disruptions. It’s well-suited for teams seeking a lightweight and automated approach to tracking vendor incidents.

However, for organizations requiring deeper metadata, component-level tracking, historical reports, and extensive integration options, StatusGator remains the more feature-rich and scalable status page aggregation solution.

​​Downdetector

Downdetector is a well-known platform that tracks outages and service disruptions across thousands of websites, apps, and online services.

Unlike traditional status page aggregators that primarily rely on official status updates from service providers, Downdetector collects real-time incident reports from users to identify potential outages.

This crowdsourced data offers early insights into service issues, although it may not always reflect official status page information.

Both consumers and businesses commonly use Downdetector to check the status of widely used services during suspected disruptions.

Free and Open-Source Status Page Aggregator

This free status page aggregator is by the creators of StatusGator. It is open-source and available on GitHub. The tool offers a self-hosted status page aggregation and lets teams consolidate multiple service status pages into one unified dashboard.

Designed for transparency and operational visibility, this tool fetches and displays real-time status data from various cloud providers, SaaS platforms, and other third-party services.

The aggregator is configurable, lightweight, and ideal for organizations that want to monitor multiple dependencies without relying solely on proprietary solutions. With support for grouping services and creating internal dashboards, it provides a flexible option for teams looking to build a custom status monitoring solution.

DrDroid Status Page Aggregator

DrDroid Status Page Aggregator is an open-source tool designed to consolidate status updates from multiple third-party service providers into a single, unified view. It helps teams monitor the health of APIs, SaaS platforms, and cloud services by pulling data from official status pages.

The tool provides a simple dashboard to visualize the real-time status of services, making it easier for engineering and operations teams to detect issues across their dependencies.

DrDroid supports filtering, grouping, and organizing services, and can be customized or self-hosted to fit specific organizational needs. As an open-source solution, it’s well-suited for teams looking for flexibility and transparency in their monitoring stack.

How to Choose a Status Page Aggregation Tool

Selecting the right status page aggregation tool depends on your organization’s needs, technical capabilities, and monitoring goals. Here are key factors to consider when evaluating tools:

1. Service Coverage

Look for an aggregator that monitors all, or most of the services critical to your operations. Some tools, like StatusGator, track thousands of vendors and offer the ability to request additional integrations. Others may cover fewer providers or require more manual configuration.

2. Early Detection

If your organization values proactive incident management, consider tools that provide early warning signals. These aggregators detect potential outages using indirect indicators, unofficial signals, or anomalies, allowing you to respond faster than relying solely on official status updates.

3. Public vs. Private Status Pages

Determine whether you need to share status data externally or keep it internal. Tools that support both public and private status pages give you flexibility to communicate service health transparently with customers or maintain internal visibility for specific teams.

4. Integration and Alerting Options

Consider how well the tool integrates with your existing systems, such as Slack, Microsoft Teams, PagerDuty, or custom webhooks. Strong integration support allows you to embed status monitoring into your operational workflows and ensure relevant teams receive timely notifications.

5. Customization and Self-Hosting

Some organizations prefer open-source or self-hosted options for greater control over data, security, or compliance. If this is important to you, look for tools that provide configurable dashboards, grouping, and filtering, along with the ability to host the aggregator internally.

6. Ease of Use and Scalability

Finally, choose a solution that balances power and usability. Whether you're a small team or an enterprise, the tool should scale with your needs while remaining easy to configure and maintain over time.

By weighing these factors, you can select a status page aggregation tool that aligns with your technical environment and resilience goals.
Key Insight into Status Page Aggregation and Takeaways

Status page aggregation simplifies monitoring

Bring together the status of all your critical third-party services, APIs, and cloud providers into one centralized dashboard — no more checking dozens of status pages manually.

Faster incident response through early detection

Advanced tools like StatusGator offer early warning signals by tracking both official status pages and unofficial indicators of disruptions.

Reduce manual overhead & complexity

Aggregation eliminates the need for custom scripts or manual checks, freeing engineering and IT teams to focus on higher-value tasks.

Tailored visibility for teams

Customize dashboards and alerts by team (DevOps, support, execs), ensuring the right people see the right information at the right time.

Historical outage insights

Aggregators store past incident data, enabling organizations to benchmark provider reliability and make smarter vendor decisions.

Flexible solutions for different needs

Choose between DIY scripts, open-source tools, or full-featured commercial aggregators depending on your team’s size, skills, and compliance requirements.

Integrate with your existing tools

Look for aggregators that support integrations with Slack, PagerDuty, Teams, webhooks, and more — embedding status monitoring into your workflows.

Pricing

Plan Price Monitors Best for
Free $0 forever 3 Trying Early Warning Signals on your critical vendors — no credit card, no catch
Starter $72/mo 25 Small teams that need private status pages and custom domains
Team $137/mo 75 Growing teams that need monitoring and third-party status page integrations
Corporate $274/mo 150 Larger teams that need incident management integrations (PagerDuty, Opsgenie)
Enterprise Custom Uncapped Private status ingestion (AWS, Azure, GCP, Microsoft 365), authenticated status pages, dedicated support

14-day free trial on every paid plan. No credit card required. Cancel anytime.

See full pricing →

Conclusion

Status page aggregation streamlines the complex task of monitoring multiple vendor statuses, delivering real-time insights, and reducing operational strain. Whether you rely on cloud providers, SaaS tools, or third-party APIs, aggregation enables faster incident responses, better stakeholder communication, and a solid foundation for uptime management.

Organizations must decide whether to build or adopt a scalable solution. DIY activism may work for small stacks, but the maintenance burden grows exponentially. Dedicated aggregators, whether StatusGator, IncidentHub, or open-source alternatives, provide robust functionality and future-proof reliability.

FAQ

Status page aggregation is the process of combining the status updates from multiple service providers, cloud platforms, SaaS tools, and APIs into a single, unified dashboard. Instead of monitoring dozens of individual status pages, you can track them all in one place for streamlined visibility and faster outage detection.
A status page aggregation works by scraping public status pages, using APIs, or subscribing to status webhooks from various services. Some tools, like StatusGator, also monitor unofficial signals and indirect indicators to provide early warnings of potential outages. This aggregated data is then displayed in real-time through a central dashboard or delivered via alerts and notifications.

The best status page aggregation tools are StatusGator. It tracks more than 10,000 status pages from cloud services, SaaS providers, and APIs. The platform offers early detection of outages, monitors unofficial signals, and supports both public and private status pages. StatusGator also integrates with Slack, Teams, webhooks, and other tools for instant notifications.

When choosing a tool, look for one that can aggregate services in one place, support real-time alerts, track unofficial outage signals, and offer easy integrations to fit your team's workflow. Some other options include IncidentHub and StatusSight.

No, status page aggregation tools like StatusGator not only track public status pages but also ingest private status APIs and track unofficial signals. This offers more comprehensive coverage and earlier outage detection. This multi-layered approach provides better insights into service disruptions that may not yet be publicly disclosed.
You can monitor third-party services by using a status page aggregator, which continuously collects status updates from the services you rely on. Instead of manually checking each provider’s status page, a status aggregator automatically tracks their uptime and incident reports in real time. Tools like StatusGator consolidate this information and can send you instant notifications when a service experiences a disruption or posts a status update.
Track the uptime and availability of third-party services efficiently with status page aggregation. A status aggregator monitors service status pages, API health endpoints, and sometimes unofficial signals to provide a complete picture of your dependencies. By subscribing to status updates via email, Slack, Teams, or webhooks, you can receive real-time alerts when uptime is affected. Some aggregators, like StatusGator, also provide historical uptime records to help you assess long-term reliability.
To aggregate multiple status pages into one view, you can use a status page aggregator platform that automatically collects status updates from various service providers and displays them in a unified dashboard. These tools support hundreds or even thousands of services and offer integrations to consolidate updates in real time. StatusGator, for example, aggregates nearly 6,000 services into one customizable dashboard, allowing you to filter, subscribe to, and track the services most critical to your organization, all in one place.
Early detection in status page aggregation refers to the ability to identify potential service disruptions before they appear on an official status page. Advanced aggregation tools, like StatusGator, achieve this by monitoring not only official API endpoints and status pages but also unofficial signals, such as changes in metadata, hidden JSON feeds, or subtle content updates on a provider’s status site. By picking up on these early indicators, the aggregator can alert users to possible issues faster than waiting for a formal status update. This provides valuable time for IT, DevOps, or support teams to investigate or mitigate the impact of a disruption.
Most status page aggregators, including StatusGator, track thousands of cloud services, SaaS tools, and API providers, but occasionally you may need to monitor a vendor that isn’t yet supported. In these cases, many aggregators offer ways to request new integrations. Thus, StatusGator’s Enterprise users can request the addition of specific vendors or private status pages that are critical to their operations. Some aggregators also provide flexible integration options, allowing you to ingest custom status data via webhooks or APIs, ensuring your dashboard reflects the full scope of your service dependencies.
UptimeRobot acquired IsDown and is launching its dependency-monitoring engine as a bundled add-on inside its uptime tool, with hard monitor caps by plan and nothing on the free plan. StatusGator is a dedicated aggregation product: Early Warning Signals is included on every plan, including Free, and vendor allowances are more generous at every comparable tier. StatusGator also monitors more services (10,000+ vs. 6,000+) and has a longer track record, including publicly documented early-detection cases like the SentinelOne outage.